January 23rd, 2026
Freeze and Reorder Table Columns
Working with wide tables just got easier. You can now freeze columns to keep key data visible while scrolling, and reorder columns by drag-and-drop to customize your view.

Other Dashboard Improvements
Text widgets can now be placed side by side (up to two per row), making it easier to add context without taking up vertical space. We've also added hover tooltips that show metric and dimension descriptions directly in tables and KPI widgets – no more guessing what a field means. And dashboards with long names are no longer truncated in the header.
Image and PDF Support in the Dema Agent
The Dema Agent can now analyze images and PDF files you share in the conversation. Upload a screenshot of a dashboard, a report, or any visual data – and ask the agent to help you interpret it.

December 19th, 2025
🚀 New Feature: Redesigned Marketing Mix Modeling (MMM)
What's New?
We've completely redesigned our MMM capabilities to give you unprecedented control and insight into your marketing performance.
Key Features:
Flexible Optimization Objectives - Customize goals beyond profit
Multiple Configuration Management - Create, save, and switch between different MMM setups
Scale Your Analysis - Handle complex multi-market, multi-channel scenarios with ease

Enhanced Understanding with Adstock Curves
New Adstock Visualization makes it easier than ever to understand the lingering effects of your advertising spend. See exactly how your campaigns continue to drive impact long after they end.
This redesign transforms MMM from a static analysis tool into a dynamic optimization engine for your marketing strategy.
🚀 New Feature: Starter Questions for Instant Agent Analysis
What's New?
Pre-built analysis templates to jumpstart your data exploration
Six ready-to-use question categories covering key business metrics
One-click insights - no more staring at blank screens wondering where to start

December 5th, 2025

We believe this will become the best AI analyst you can have for e-commerce and retail.
We’re launching the first version of Dema Agent in Beta. In many ways it works exactly as you’d expect — and in a few ways it will surprise you. Beta access is available to all Dema users, but it’s request-only for now. To join, simply fill out the form linked below and we’ll get you set up.
The Agent launches with three core execution modes:
Product segmentation: Create product segments faster and smarter than ever before — ready to steer your marketing in no time.
Customer segmentation: Get instant, powerful customer segments to follow in reports and dashboards, or to activate directly in your CRM.
Reports and dashboards: Finish a conversation by saving insights to a report or dashboard with one click, making them easy to share with colleagues.
Want Beta access and a first look at what Dema Agent can do? Request access via this form. If you get in early, we may ask you for a short testimonial we can use in marketing.
November 7th, 2025
New time filter option: Added "Last 3 days" to segmentation filters for more granular data analysis.
Various bug fixes to improve the stability and user experience of the platform.

October 10th, 2025
What's New?
We've supercharged the segmentation platform to make creating and managing rule sets faster and more intuitive than ever!
Quick-start templates for instant segmentation setup
Drag-and-drop rule reordering for effortless configuration
Streamlined navigation throughout the segmentation interface

🔧 Better Rule Builder: These updates make building complex segmentation strategies more accessible while maintaining the powerful functionality you rely on. Get started with templates and customize from there, or build completely custom rule sets with our improved interface!

September 12th, 2025

🔧 Chart Improvements
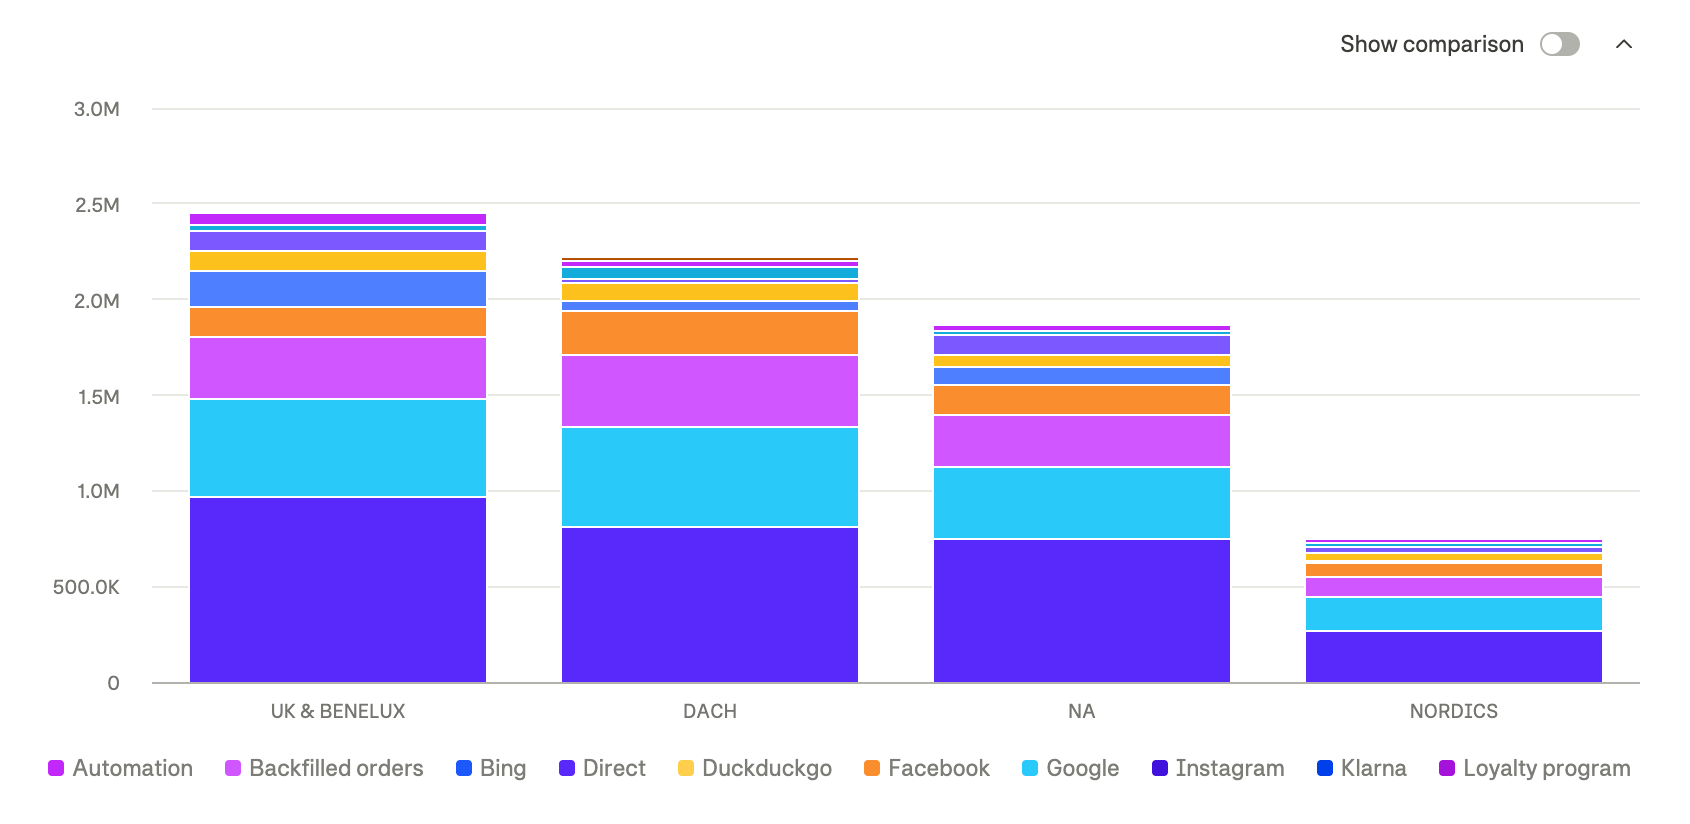
Stacked bar charts now sort more intuitively
Enhanced how data appears in your stacked bar charts, making it easier to identify trends and compare values across categories.
Chart bug fix
Resolved an issue that was affecting chart display and functionality, ensuring a smoother visualization experience.
⚡️ Performance Enhancement
Faster loading for large reports
Implemented improvements that significantly reduce loading times when working with datasets containing large amounts of data. Your analytics workflows just got a lot faster!
August 29th, 2025

Big changes in the platform you probably won’t notice
We’ve made some major improvements to the platform over the summer. But ideally, you won’t even notice them. We’ve updated the UI with a new font, slightly reduced the font size – so you can view more data at once – and adjusted the color system to improve contrast.
For us, these changes have been significant. But hopefully, the only thing you’ll notice is that Dema looks and feels just a little bit smoother.
June 11th, 2025

We’ve upgraded how you segment customers and products, making it easier—and now nicer to work with.
You can now:
Use different time ranges within the same segment
– e.g. Top 10% customers by spend in the last 12 months AND 0 orders in the last 30 daysCombine multiple behavioral, marketing, and inventory filters
– e.g. Marketing spend bottom 30% last week AND top 10% last 30 days AND inventory > 0
This unlocks smarter strategies like identifying valuable customers who haven’t purchased recently, or targeting products with high marketing investment that are still in stock.
Segmentations are more powerful, flexible, and designed to support next-level actions across marketing, inventory and retention.
June 11th, 2025
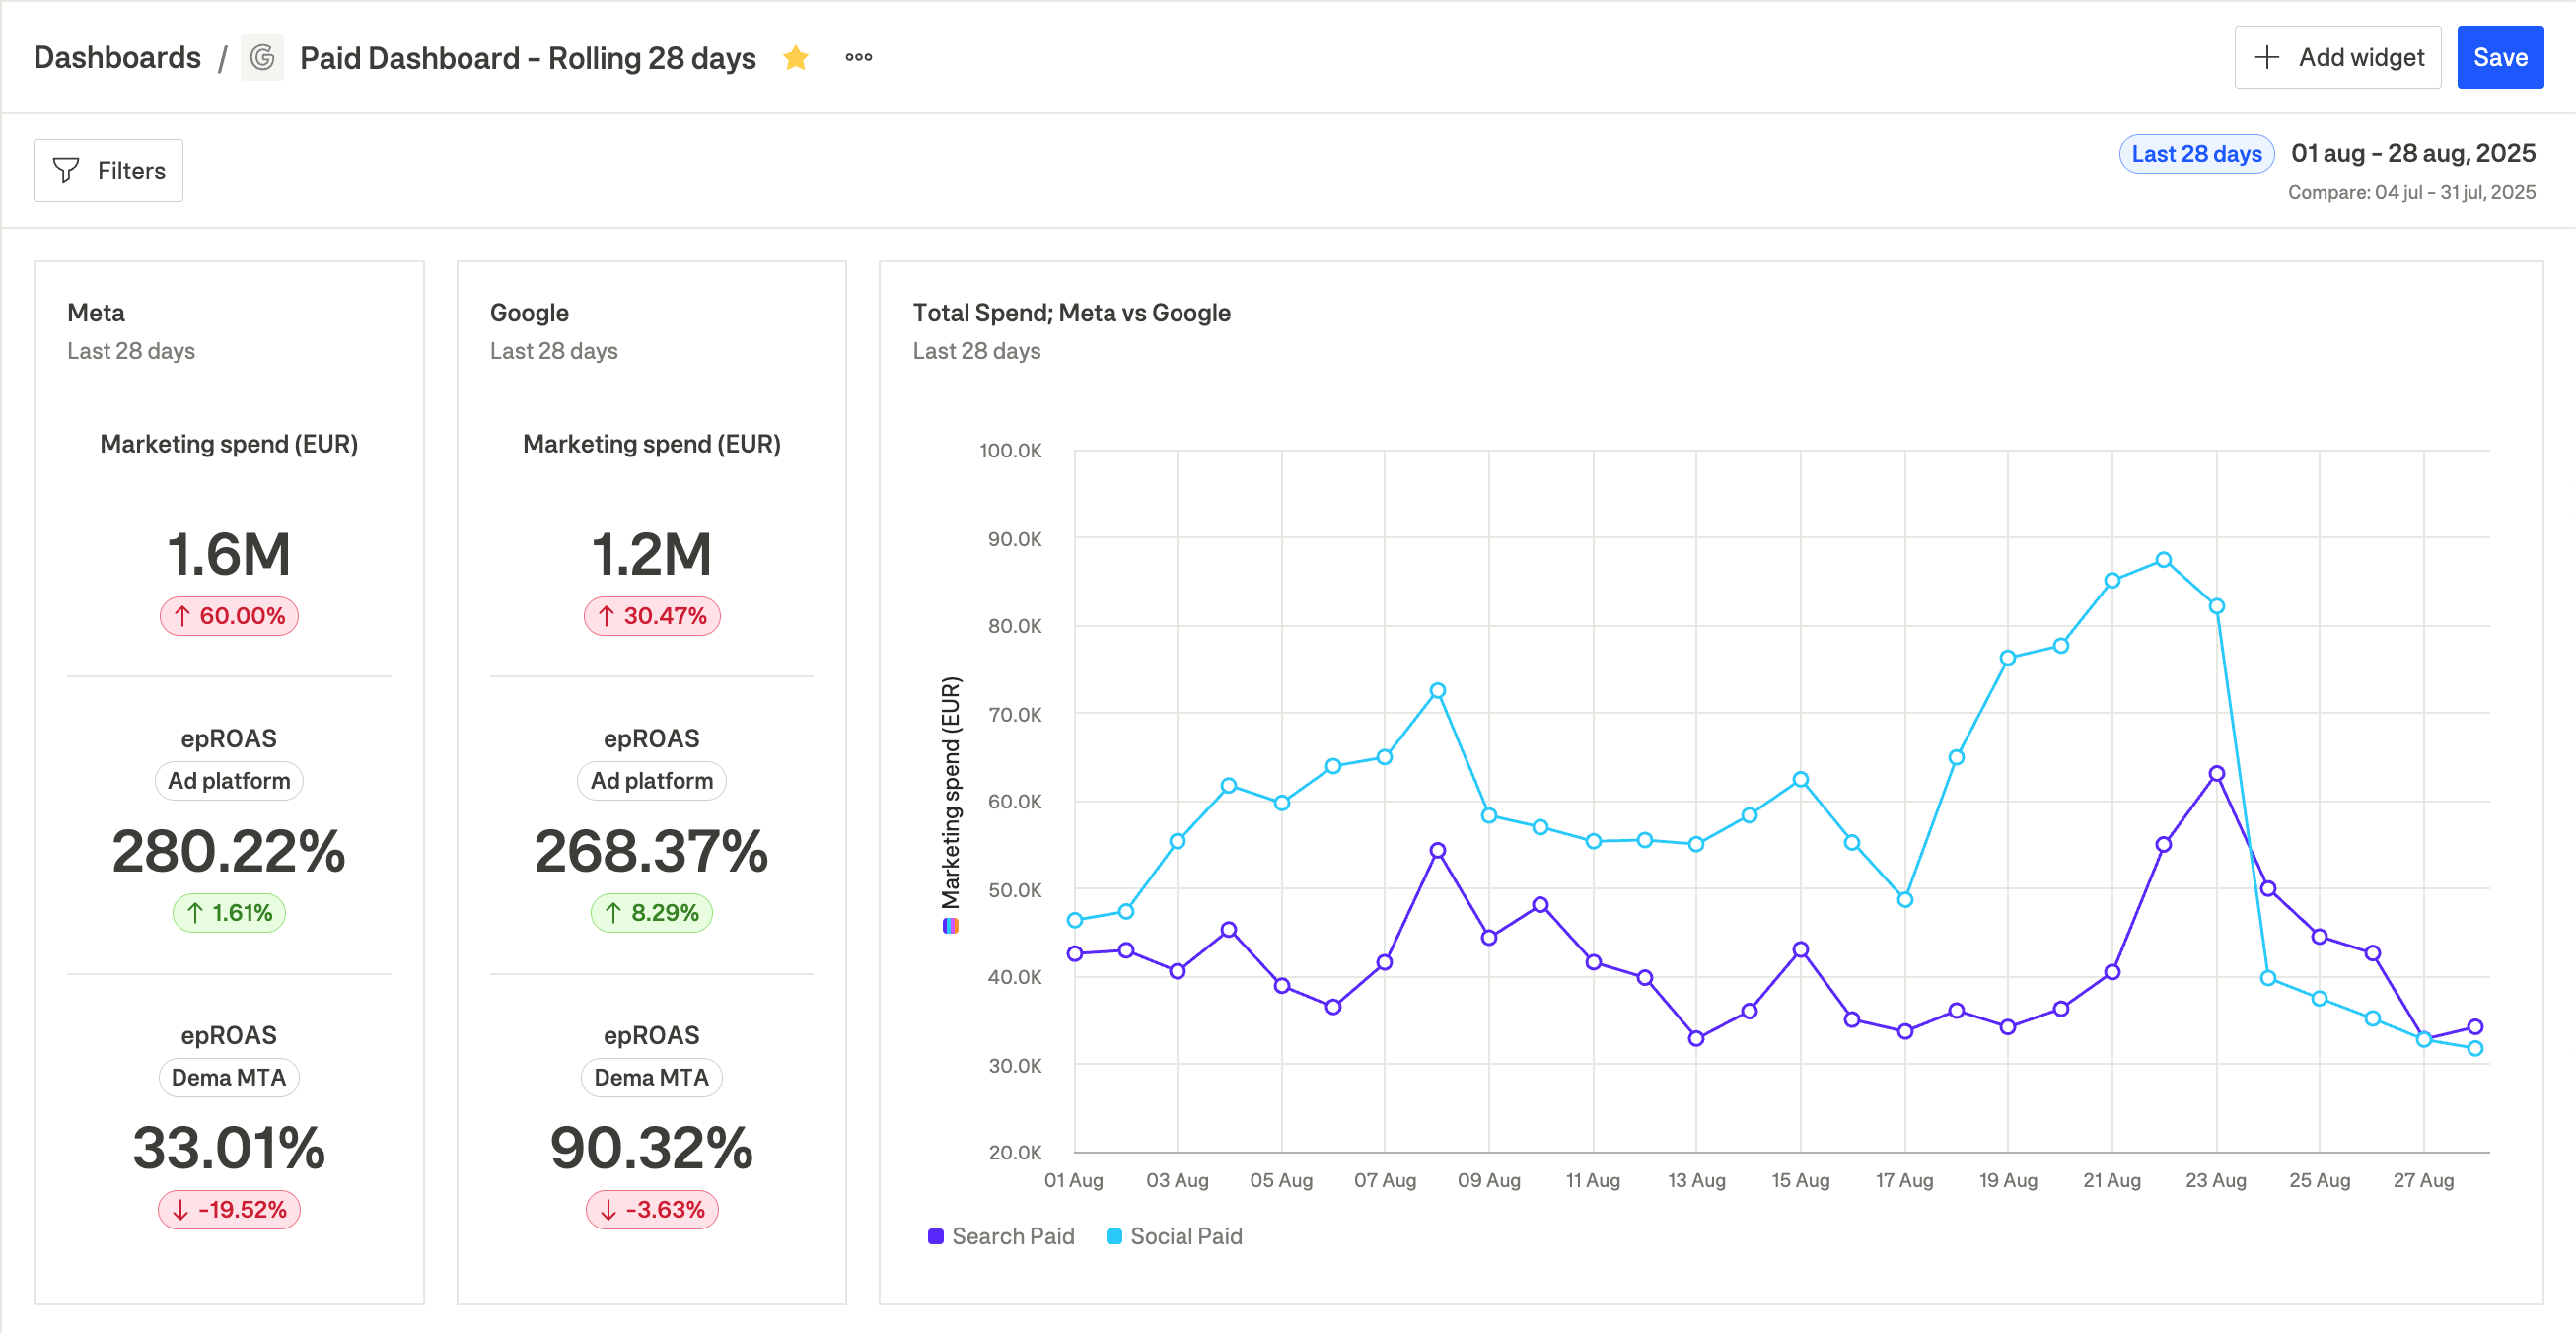
We’ve just launched Custom Dashboards, a powerful new way to visualize what matters most to your team.
With Custom Dashboards, you can:
Combine metrics across reports – Bring together data from performance, product, or profitability views.
Compare time ranges side-by-side – Look at week-on-week or YoY performance in a single glance.
Forecasting in charts - See forecasts for sales, profits, AOV, visits and more directly in charts
Use multiple widget types – Line charts, tables, KPIs, and more—mix and match to suit your needs.
Apply filters and tailor each view – Choose dimensions like channel, product category, or region to slice your data exactly how you want.
This feature is already live in your account. You’ll find the option to create a new dashboard right from your Dema workspace.
What happens to existing dashboards?
We’re replacing the old dashboards with Custom Dashboards to give you more flexibility.
But don’t worry—the original dashboards are still available under the “Dema team” section in the left-hand sidebar.
June 2nd, 2025
We’ve added several new Meta-specific metrics to give you a more detailed view of your ad performance:
Reach – Unique users per day who saw your ad.
Note: This is calculated per day. If you compare with Meta’s 7-day view, our number will appear higher.Inline link clicks – Clicks on links in your ad.
Inline post engagement – Total engagement: reactions, comments, shares, views, and clicks.
Video thruplay watched – Count of times video ads were played to completion or at least 15 seconds.
Video play actions – Count of times video ads started playing.
These metrics are currently backfilled 1 month back. In the upcoming weeks we will backfill all historical data for these metrics.
We’ve also added a range of Meta-related dimensions to support better grouping and segmentation:
Campaign daily budget
Ad set daily budget
Buying type
Performance goal
Campaign objective
Attribution setting
Campaign delivery – Active/inactive status
Incremental attribution enabled – True/false
Creative ID
Creative media type – e.g. carousel, image, video, automatic
Note: We map this ourselves from raw creative data.Creative format
Creative body
Creative CTA
Creative headline
These updates help you break down campaign performance with more granularity and precision.